|
In my first blog post, I will discuss a recent paper about Wolbachia classification. In a recent study, Wang et al. (2016) investigated Wolbachia sequences from cave spiders (Telema ssp.). They found that these belong to a genetic lineage distinct from all other described Wolbachia strains (in Wolbachia, those genetically distinct lineages are called “supergroups”). I re-analysed these data and found that in fact, Wolbachia strains from cave spiders cluster within supergroup A (Gerth 2016). [If you are unfamiliar with Wolbachia biology, or the supergroup classification system, the excellent review by Werren et al. (2008) is a good starting point.] After I uploaded my re-analysis to bioRxiv, Guan-Hong Wang has kindly send me the alignment files they used in their study. In this post, I want to try to use these data and illustrate why their and my analysis are discordant and also, why their conclusions are likely misled. 1) Localizing the discordance Wang et al. have analysed 3 protein coding genes (coxA, ftsZ, groEL), and the 16S rRNA gene. Their and my single gene analyses are in agreement for three of these genes: coxA, ftsZ, and 16S. When we have a look at a tree based only on these loci concatenated (Fig. 1), Wolbachia from Telema are clearly supergroup A strains. 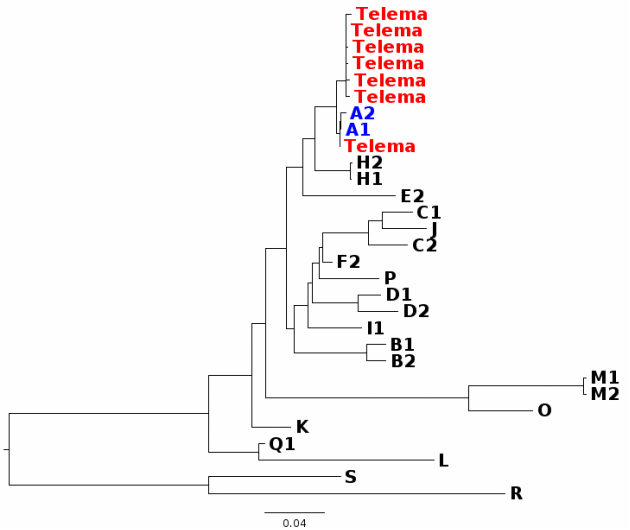 Figure 1: Wolbachia phylogeny based on concatenated dataset of ftsZ, coxA, and 16S. Capital letters stand for Wolbachia supergoups, R & S are outgoups. Numbers are given when multiple strains from a single supergroup were used. Wolbachia from Telema are highlighted in red, supergoup A reference strains in blue. ML tree based on nucleotides calculated with RAxML version 8 under GTRGAMMA model of evolution. Figure 1: Wolbachia phylogeny based on concatenated dataset of ftsZ, coxA, and 16S. Capital letters stand for Wolbachia supergoups, R & S are outgoups. Numbers are given when multiple strains from a single supergroup were used. Wolbachia from Telema are highlighted in red, supergoup A reference strains in blue. ML tree based on nucleotides calculated with RAxML version 8 under GTRGAMMA model of evolution. However, when analyzing the groEL gene, Wolbachia from Telema are suddenly very distinct (Fig. 2). At first I speculated that this may have been an alignment artifact, but now that I have the alignment files, this can be excluded. 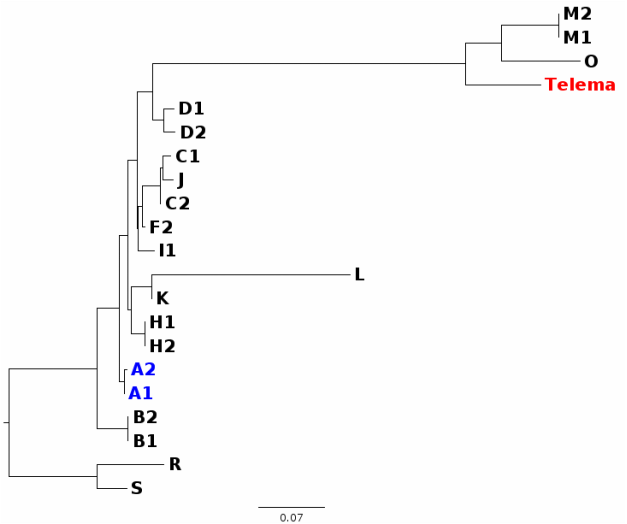 Figure 2: Wolbachia phylogeny based on groEL nucleotide sequences only. So in summary, the discordance stems from a single locus, and in fact even from a single sequence (as groEL was only amplified from a single Telema individual). When concatenating all four loci, the phylogenetic signal of this single locus “pulls” Telema away from the other supergroup A strains. Next step is of course, 2) Trying to determine what causes this discordance My first thought was recombination. GroEL may have come from another Wolbachia strain. However, Wang et al. tested for recombination and could not detect any. Also, I created trees for 100bp sliding windows across the groEL locus and checked for any discordances, but there were none. A thing that seemed very suspicious in the groEL tree from the beginning is the long branches leading to Telema Wolbachia and to groups O and M (Fig. 2, also Supplementary Figure 1D in Wang et al. 2016). There is a phenomenon in phylogenetics called “long branch attraction” (LBA). Very simply put, LBA describes the observation that in phylogenetic reconstructions, taxa that are very different from the rest of the dataset often cluster closely together. However, this clustering is not due to shared similarities, but rather to “shared dissimilarity” in comparison to the rest of the taxa. Fig. 2 definitely looks like there is a problem with LBA. Now, what can cause these differences? One thing to look at is base composition. For various reasons that are not 100% clear (see e.g., Rocha & Danchin 2002), nucleotide base compositions can be very different between genomes – in Bacteria the GC contents can vary between 25–75%! Base compositions that differ between lineages may be a problem in phylogenetics, simply because the great majority of phylogenetic models in use does not consider base compositions. Or, in other words, an inherent assumption of most phylogenetic models is that base compositions are equal in all lineages. Naturally, this assumption is violated in most datasets, but often, this does not have a big impact. Fig. 3 shows the groEL tree again, this time with GC contents given at the tips of the tree. 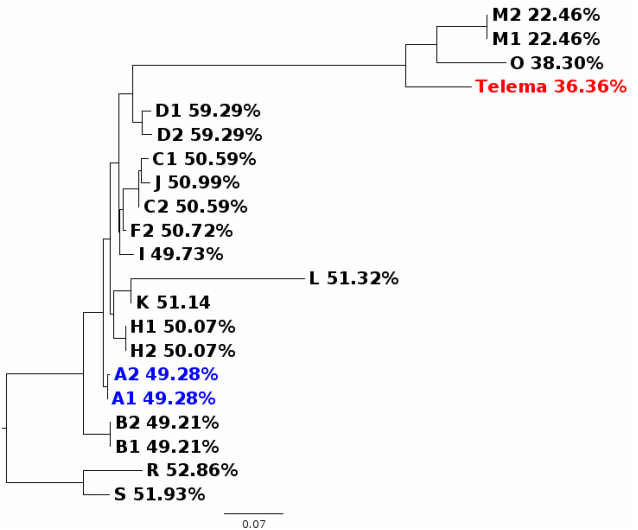 Figure 3: Wolbachia phylogeny based on groEL nucleotide sequences only, with GC contents of groEL sequences shown at tips. I think the picture is quite clear: All Wolbachia and outgroup groEL nucleotide sequences are composed of about 50% GC. The sequences at the end of the long branch (M, O, and Telema) show a much lower GC content. Normally, I would suggest to exclude loci with such pronounced compositional bias from the analysis. However, in this case we want to know if Wolbachia from Telema is actually distinct at this locus, so that leaves us with another option: analyzing amino acid sequences instead of nucleotides. [Another option would be to use nhPhyML (Boussau & Gouy 2006), a program that accounts for and models differences in base composition]. If Telema sequences are in fact distinct from all other supergroup strains, they should also be in the amino acid analysis. If however, the placement of Telema groEL is an artifact of base composition, the amino acid sequence should be similar to supergoup A strains. Fig. 4 shows the tree groEL tree based on amino acid sequences. 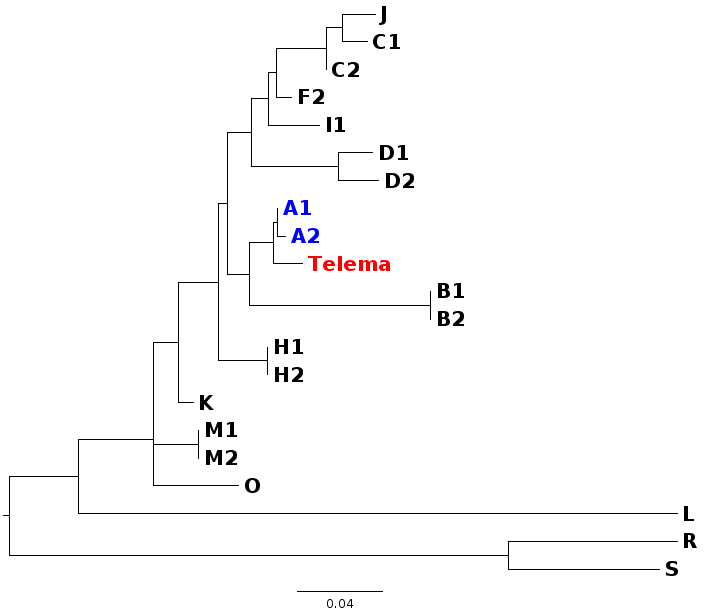 Figure 4: Wolbachia phylogeny based on groEL amino acid sequences. Incidentally, the gene tree matches pretty nicely with what is known of Wolbachia phylogeny (Gerth et al. 2014). Again, the picture is quite clear, Telema is closely associated to supergroup A strains. What this means is that Telema-Wolbachia and other supergroup A strains share a recent common ancestor, in which the groEL gene was already present. In the lineage of Telema hosts, the GC content within this gene was then subsequently reduced. Fig. 5 shows that most of the mutations that have led to this reduction were affecting the third codon position (grey highlight), so in many cases, these would not result in a change on the level of amino acids. Consequently, the amino acid sequences from Telema and other supergroup A sequences are still very similar, despite large differences in nucleotide base composition. 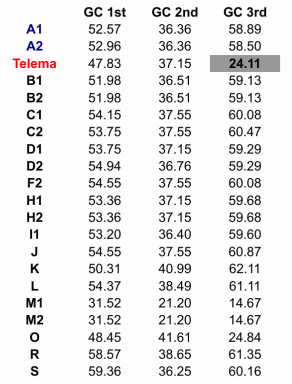 Figure 5: %GC content of groEL sequences from analysed Wolbachia strains and outgroups. As my last point, I want to mention that base composition bias in bacterial datasets has been recognized as a problem in phylogenetics for quite a while now – see e.g., the very nice studies of Herbeck et al. (2005) and Husník et al. (2011). 3) Summary & conclusions
COMMENT: The analysis I submitted in reply to the Wang et al. paper also shows clearly that Wolbachia from Telema is a supergroup A strain. However, it is not based on exactly the same dataset as Wang et al. used, and it does not analyse base composition bias in the groEL gene. I will make the above blog post available as supplementary material for the paper, which is still under review. References Boussau B, Gouy M (2006) Efficient likelihood computations with nonreversible models of evolution. Systematic Biology 55, 756–68. Gerth M (2016) Classification of Wolbachia (Alphaproteobacteria, Rickettsiales): No evidence for a distinct supergroup in cave spiders. bioRxiv , doi:10.1101/046169. Gerth M, Gansauge M-T, Weigert A, Bleidorn C (2014) Phylogenomic analyses uncover origin and spread of the Wolbachia pandemic. Nature Communications 5, 5117. Herbeck JT, Degnan PH, Wernegreen JJ (2005) Nonhomogeneous model of sequence evolution indicates independent origins of primary endosymbionts within the Enterobacteriales (γ-Proteobacteria). Molecular Biology and Evolution 22, 520–532. Husník F, Chrudimský T, Hypša V (2011) Multiple origins of endosymbiosis within the Enterobacteriaceae γ-Proteobacteria: convergence of complex phylogenetic approaches. BMC Biology 9, 87. Rocha EP, Danchin A (2002) Base composition bias might result from competition for metabolic resources. TRENDS in Genetics 18, 291–294. Wang G-H, Jia L-Y, Xiao J-H, Huang D-W (2016) Discovery of a new Wolbachia supergroup in cave spider species and the lateral transfer of phage WO among distant hosts. Infection, Genetics and Evolution , doi:10.1016/j.meegid.2016.03.015. Werren JH, Baldo L, Clark ME (2008) Wolbachia: master manipulators of invertebrate biology. Nature Reviews Microbiology 6, 741–751.
1 Comment
Waschi
28/10/2016 08:54:40
That's impressing! Leave a Reply. |
Welcome!This is the website of Michael Gerth. I am a biologist with an interest in insects and the microbes within them. Click here to learn more. Archives
June 2022
Categories
All
|
 RSS Feed