|
Before writing about science again (new post is in the making), I have uploaded two scripts that I find useful for my work: gc_cov.pl This script is basically a very simplified version of the blobplots function from the BlobTools package. It creates GC-coverage plots directly from SPAdes assembly files, without the need for mapping the reads back to the assembly. Since I use mainly SPAdes anyway, this has been quite handy. The script will also annotate the plot when a taxonomy file is provided, which can be generated, e.g., from blast outputs. Below is an example for the plots that can be generated with the script. 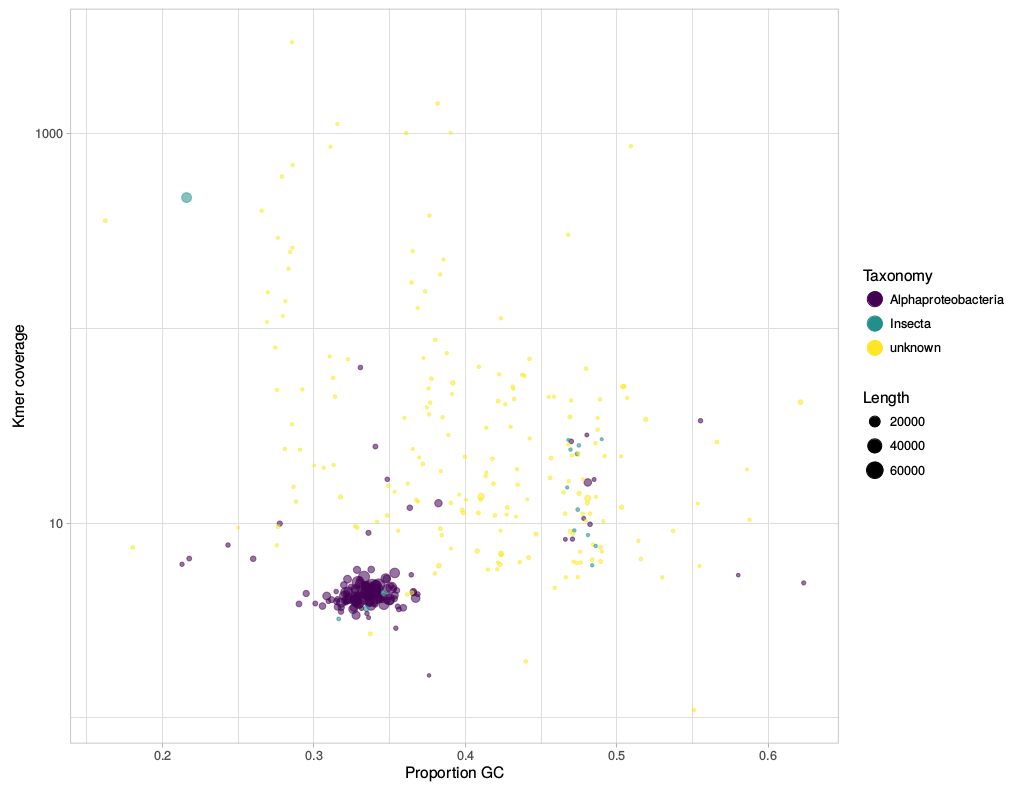 pbplot.R This is a tool to plot trace parameters estimated during PhyloBayes analyses, directly from the directory in which the analyses are/were run. I use this to check if chains appear to be converging, to identify "problematic" chains, and also to estimate suitable burnin sizes. It is not meant to provide an exhaustive diagnosis of the mcmc runs, but rather as a quick look into ongoing analyses – the plots are generated almost instantly and plotted to the screen or pdf. See below for examples. 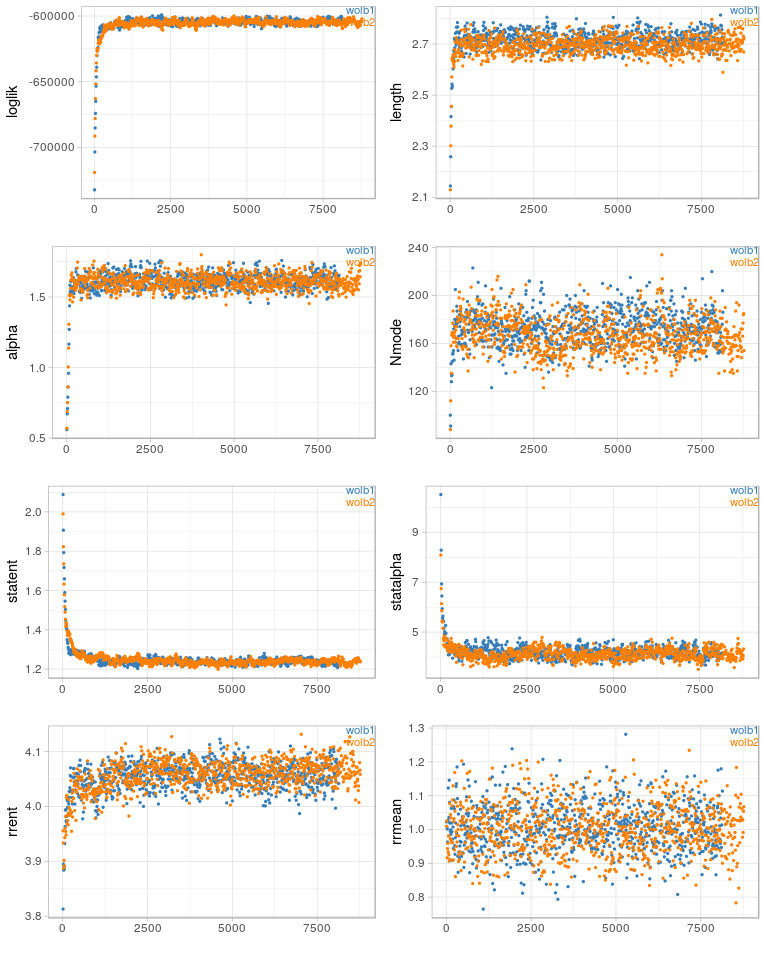 Trace parameter vs iteration plots. 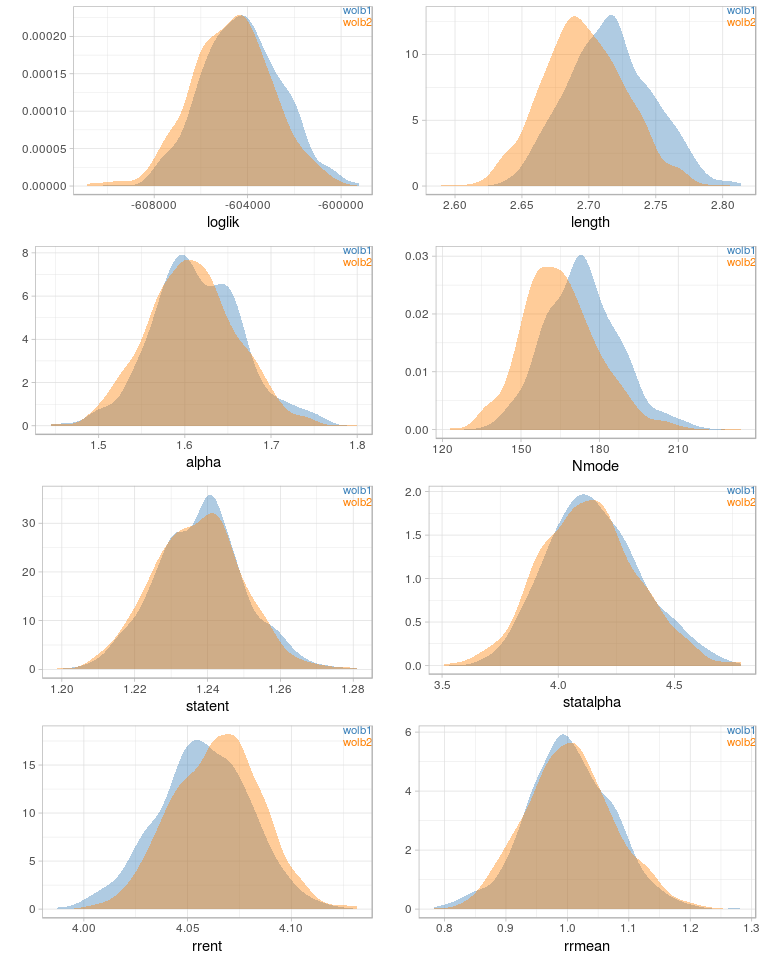 Trace parameter density plots.
1 Comment
|
Welcome!This is the website of Michael Gerth. I am a biologist with an interest in insects and the microbes within them. Click here to learn more. Archives
June 2022
Categories
All
|
 RSS Feed